Due to the Work From Home policy recently, I need a way to do some exercise at home. I bought a 1/4 size table tennis table, and a practice board (red rectangle in the video) to help re-bouncing the ball back. While it works as a way to sweat a bit, it’s not showing how’s the practice performance, and how much time I spent. I would like to have a way to track all the information for each practice, as a reference for later improvement. Moreover, humans like to read numbers. Numbers are magic to motivate people to do something more.
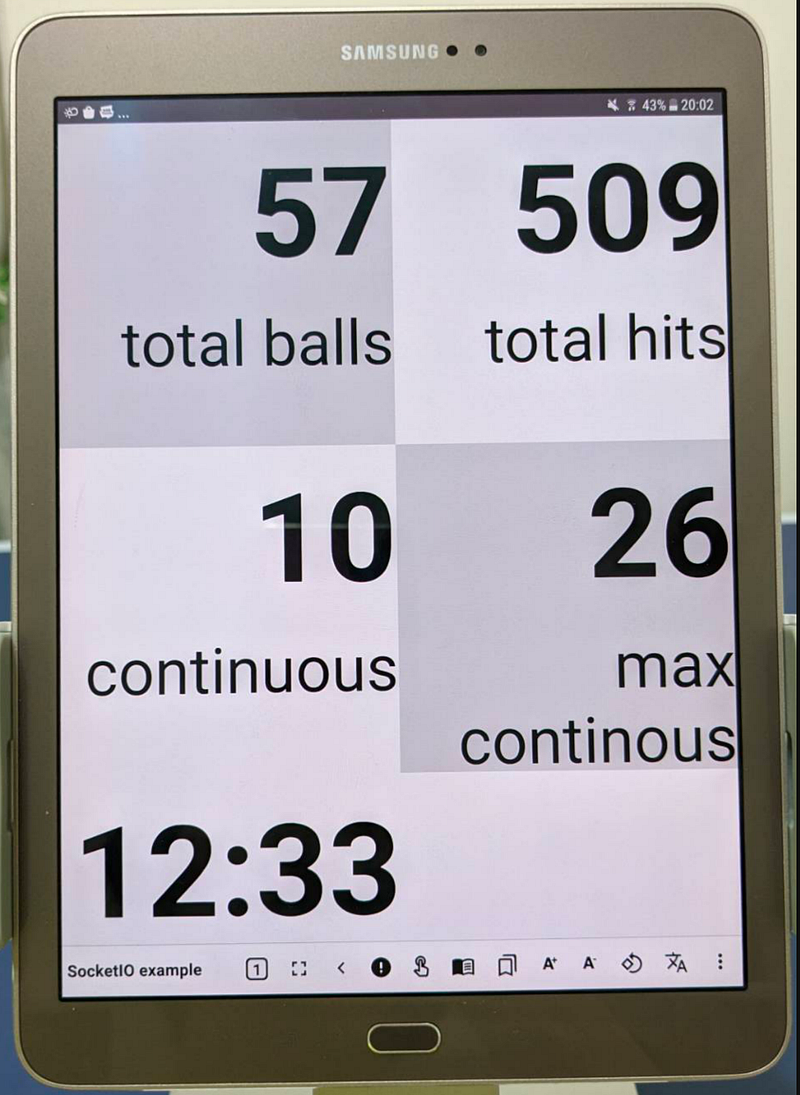
After some trial and error, I built up a system to show the most important numbers during my practice:
- how much time passed,
- how many balls I used,
- how many hits I made,
- current continuous hits,
- and maximum continuous hit.
Now, I will explain how the system is built up.
Architecture
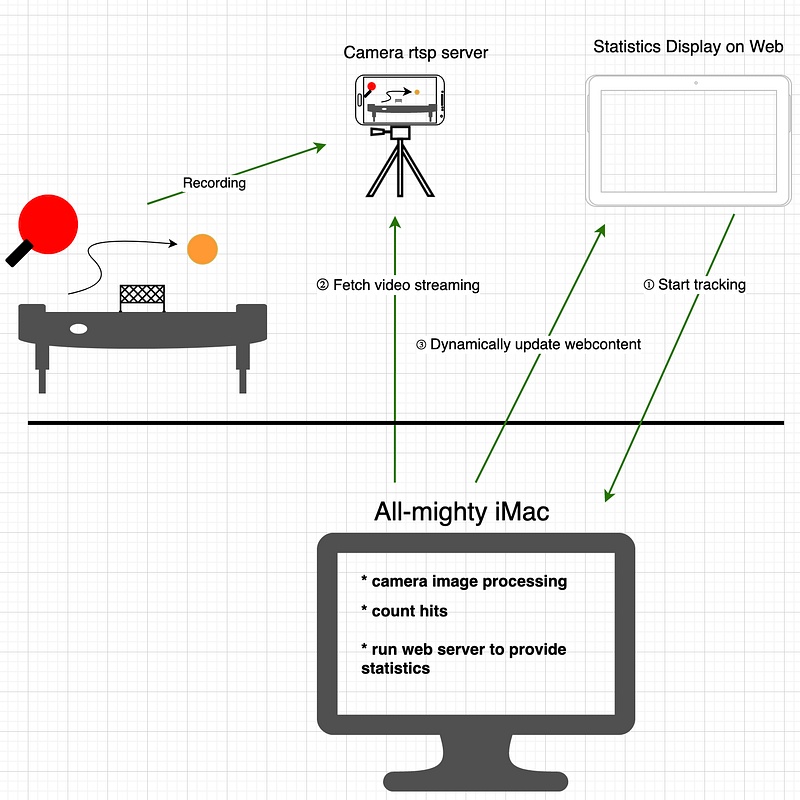
The system is built by three components:
- a mobile phone to record the practice scene and serve as an RTSP streaming server;
- a desktop PC (I use iMac) for processing the streaming content, and serve as the webserver too;
- and a tablet, or another phone to show the current statistics.
A mobile phone is used to record the practice scenes, and stream the video to an iMac machine where python script is run to process image information, and then a web server is set up on iMac to show the current statistics to a remote Android tablet that is close to the table tennis table.
RTSP streaming
The first part is the easiest part; I downloaded Spydroid from the Fdroid website. It’s a mobile app that can record videos and stream them through RTSP protocol with several flexible configurations. Since I planned to leave all the heavy work done on PC, I just need a device to capture the practice images continuously and send them to the PC. Spydroid just fits my needs perfectly.
Spydroid | F-Droid - Free and Open Source Android App Repository
Image Processing
Image processing is done by python scripts with the help of the OpenCV library. OpenCV library is a very mature and popular solution for dealing with images. A lot of resources can be found on the internet too.
I use OpenCV to detect whether there’s any image difference (comparing to the first image where the ball is not entering the screen yet) on the left side of the image. Usually, I stand at the right side of the table, and the practice board is set on the left side. That’s why I only detect the left side of the image. if so, count it as one hit after the image difference is gone (which means the ball leaves the screen again).
The algorithm is referenced from the following links:
Basic motion detection and tracking with Python and OpenCV - PyImageSearch
The main implementation of the image processing is at detact_area_change.py .
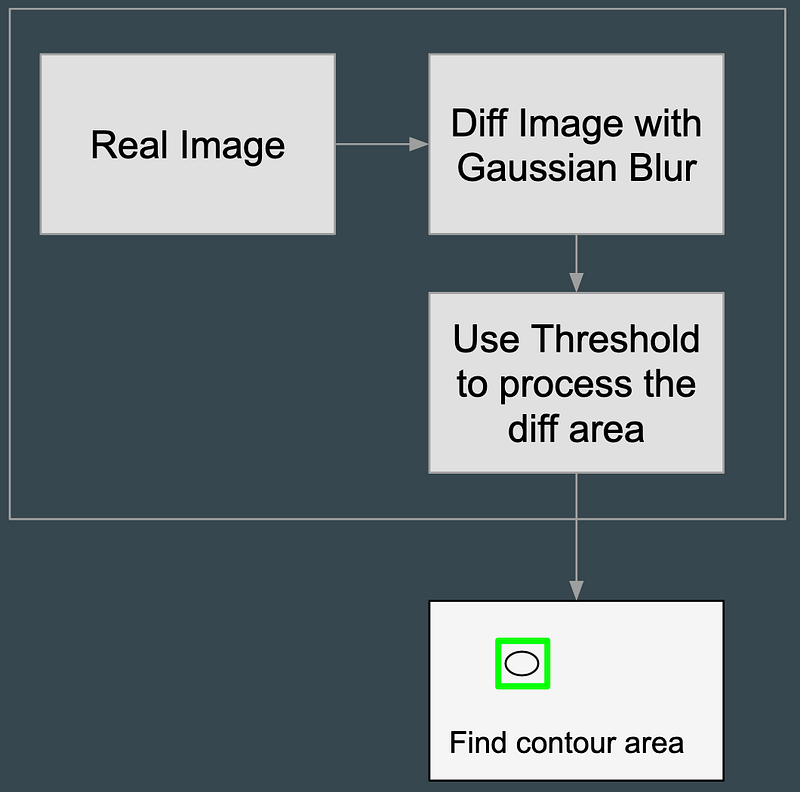
Here’s a video to demonstrate how the image processing goes:
And a simple explanation for that process:
Code Explanation
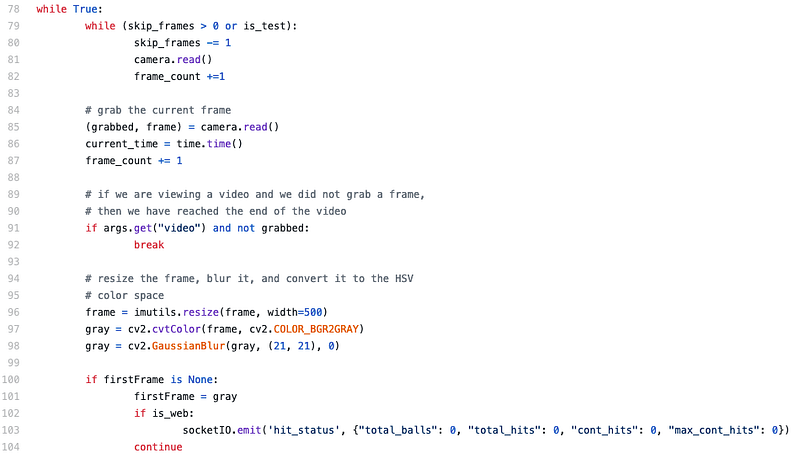
In the beginning, several frames are skipped due to the video recording is not stable, the contrast will become stable after 1 to 2 seconds, I skipped these frames in lines 79 ~ 82. At lines 96~ 98, each frame is resized to a smaller one, and convert to a gray image (since the color is irrelevant), and applied Gaussian blur for reducing small noises.
When all is done, the first frame will be remembered (at line 101) as the background for comparing the following changes.
In lines 106 to 108, images are compared and filter some threshold to make sure the result is what I wanted. And then, callfindContours for following actions.
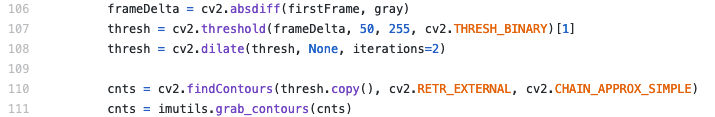
Each contour data is measured to filter out too small changes (at line 116). Only the left side of the image (at line 121) is considered. A rectangle is drawn for the area. And then line 125 ~ 148 is calculating whether it’s a new ball, a new hit, or a new record for max consecutive hits.
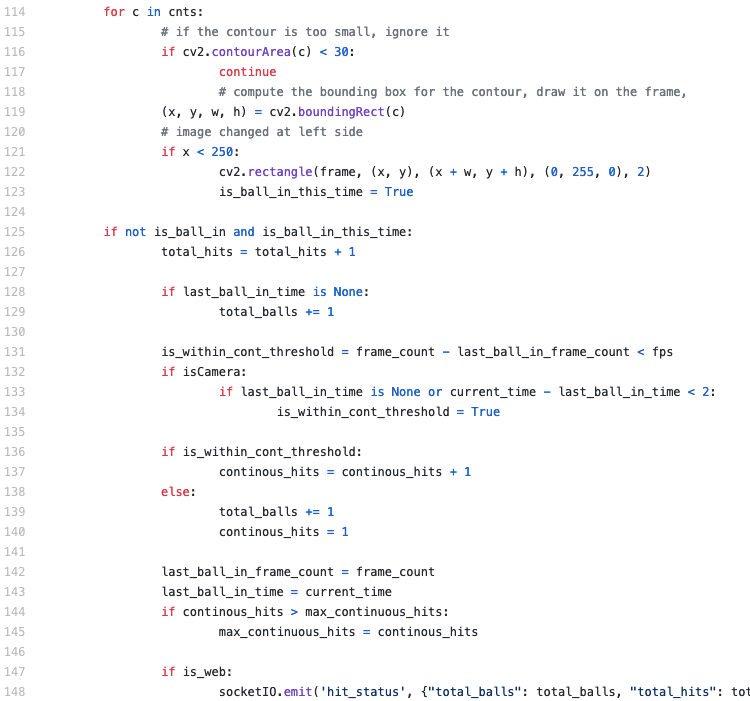
If the time difference between two hits is close enough, say, within 1 or 2 seconds, I assume they are consecutive hits with the same ball (at lines 132 ~ 134). This is how I calculate current consecutive hits and the maximum consecutive hits.
When the image data is processed, the results should be sent somewhere so that I can see it while practicing table tennis (at line 148).
Web Server by Python and Flask
I decided to write a web server on iMac instead of writing an App for tablet or mobile hone because it’s easier. The web server is written with Python and Flask. And I also used SocketIO library to make it faster.
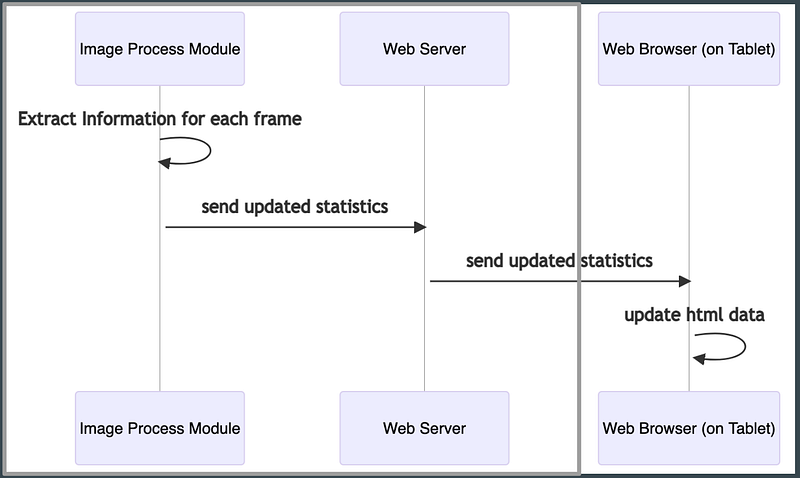 Sequence diagram for iMac and Tablet
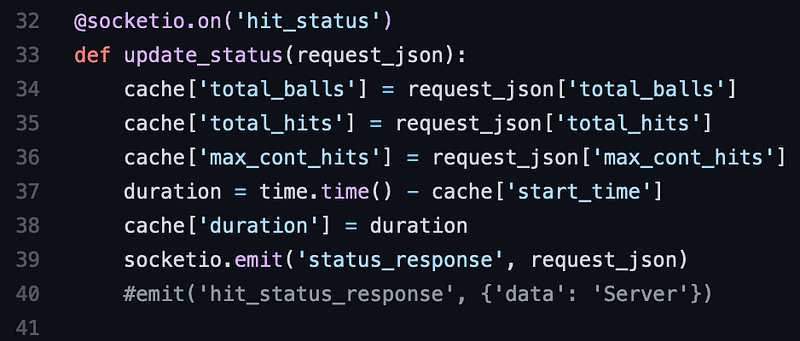
When receiving hit_status events from detect_area_change.py through SocketIO, the Web server will emit a status_response event to Web page to update what user can see now.
Showing Statistics on Web
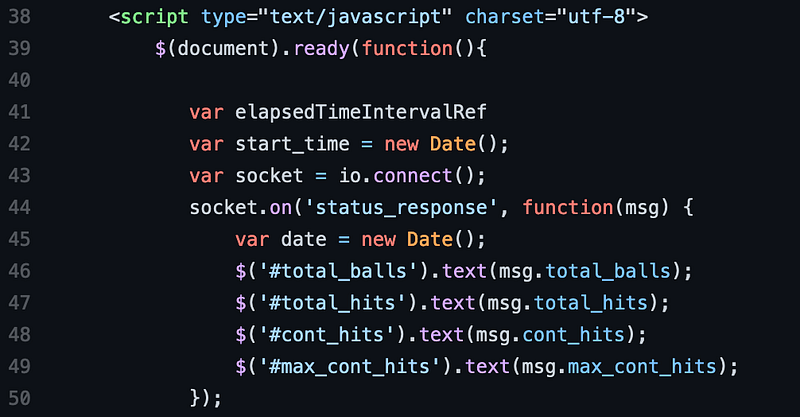
When getting status_response from the webserver, the web page will update the content accordingly. Here’s the code snippet: on the web page, there are dedicated elements for the information I need. I just change the text when new values come.
Here’s the sample web content demo:
Start and Stop the Tracking
A Tracking button is added to the bottom of the web page. If it’s clicked, it will trigger the webserver to start reading RTSP streaming data from the mobile phone, and start the whole process.
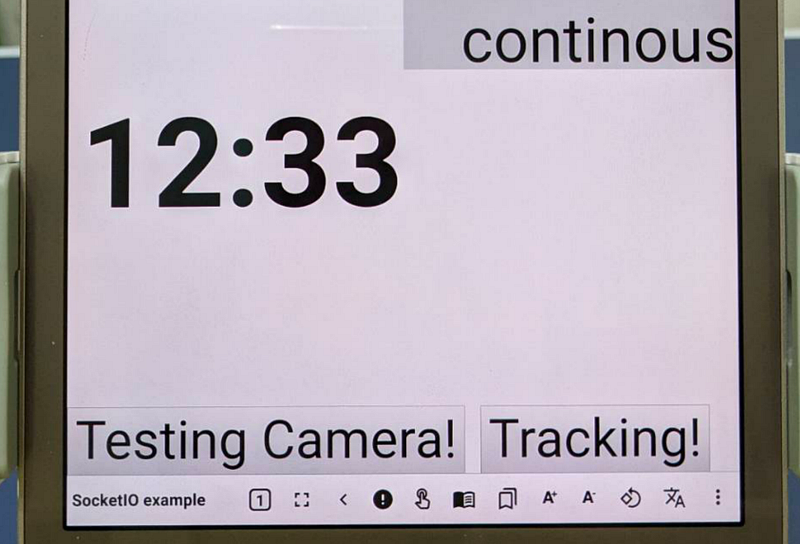
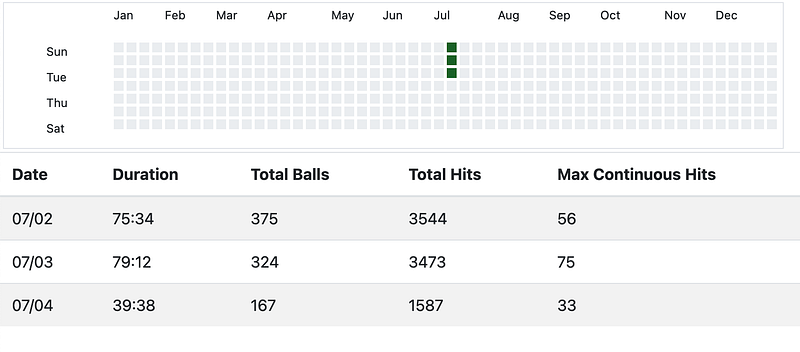
When clicking on the same button again, it will stop the image processing, and save current statistics to a local file. These data can then be used to present the training trend and effort.
The codes are not well written, since it’s only a proof-of-concept solution and used for personal use. However, I think the concept can be easily applied to other possible scenarios too. Hope you find this article helpful for your own sports practice at home.